Stats Tab
 What the language model is
costing you, in tokens and in latency.
What the language model is
costing you, in tokens and in latency.
A token is the basic unit of language-model compute — roughly a word or a number. If you are on a paid cloud provider, tokens are the meter.
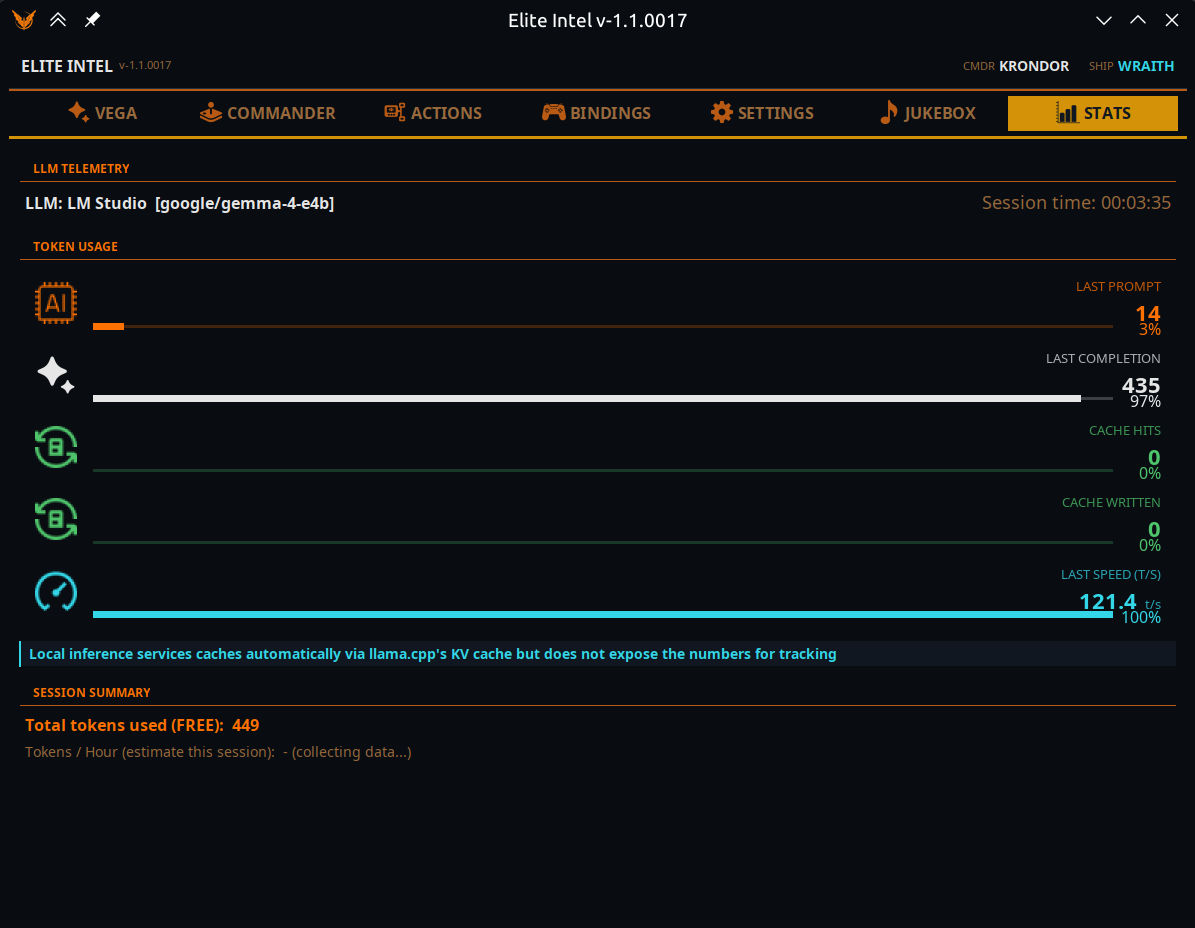
LLM Telemetry
The model actually serving your requests, and how long this session has been running. The model name is what answered — not what you configured — so this is where you confirm your provider switch really took effect.
Token Usage
Five bars. These describe the most recent request, not the session, so you can see the shape of a single exchange.
| Cell | Meaning |
|---|---|
| Last Prompt | Input tokens sent |
| Last Completion | Output tokens generated |
| Cache Hits | Input served from cache instead of being re-billed |
| Cache Written | Input written into the cache for later requests to hit |
| Last Speed | Tokens per second |
The four token bars fill as a share of that one request's total, so they read as a composition. Speed has no fixed ceiling, so its bar fills relative to the fastest response seen this session.
Session Summary
| Line | Meaning |
|---|---|
| Total tokens used | Labelled (FREE) on a local model, (chargeable) on a cloud one |
| Tokens saved by caching | Cloud only. Says "served at reduced rate" once there are hits |
| Tokens / Hour | A projection. It reads "collecting data…" for the first 10 minutes, because a rate extrapolated from two minutes of play is a fiction |
What the numbers mean in practice
A typical session runs somewhere around 250k tokens per hour in total.
Elite Intel's cloud integration is tuned per provider for maximum prompt caching, and cached tokens are either free or billed at a reduced rate. How much of that 250k gets cached depends entirely on the provider — some cache up to 80% of it, others closer to 40%. That difference is the main thing separating a cheap provider from an expensive one, and it is worth watching here for a session before you commit.
On a local model there are no cache figures. Local inference does cache — llama.cpp keeps a KV cache and uses it — but it does not report the numbers, so there is nothing honest to show. The panel says so rather than displaying a misleading zero, and hides the cache line entirely.
For a live at-a-glance version of the same data, the Vega tab carries a six-block System Summary strip along the bottom.
Community 👉Matrix👈